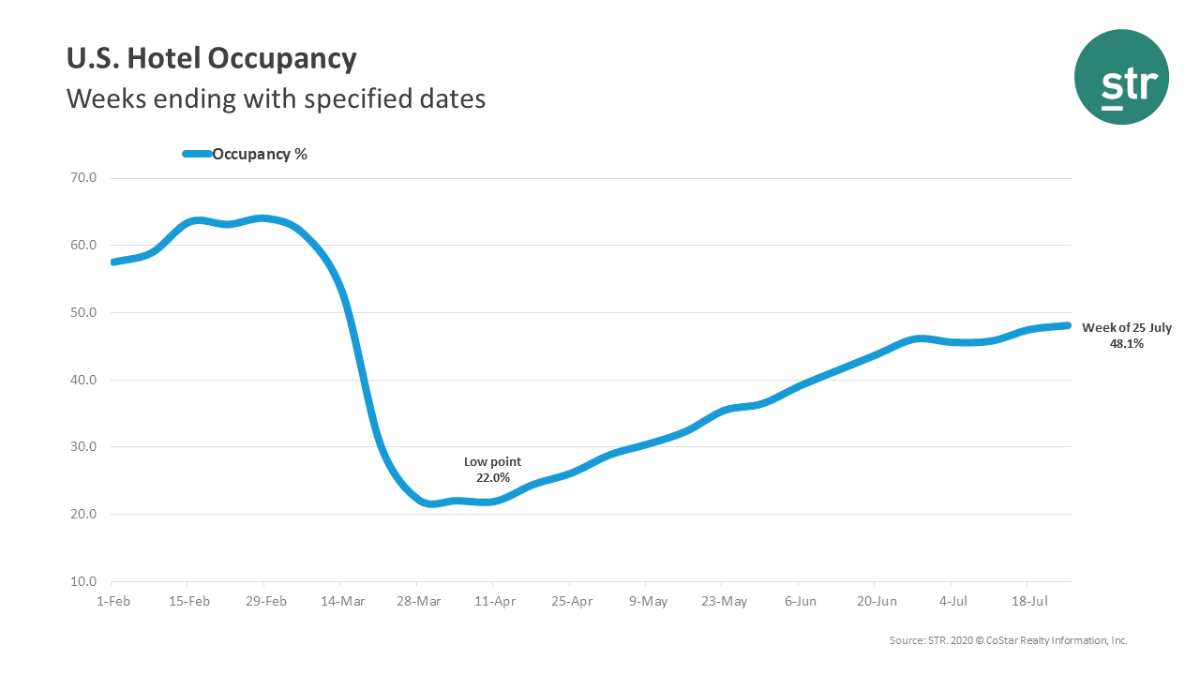
HENDERSONVILLE, Tenn.—U.S. hotel performance data for the week of July 19-25, 2020, showed slightly higher occupancy and room rates from the previous week, according to STR.
U.S. Hotel Industry KPIs
July 19-25, 2020 vs. July 21-27, 2019
Occupancy: 48.1% (-37.9%)
ADR: $99.24 (-27.3%)
RevPAR: $47.75 (-54.8%)
Compared to the same week last year (July 21-27, 2019), occupancy declined 37.9 percent to 48.1 percent, average daily rate (ADR) dropped 27.3 percent to $99.24, and revenue per available room (RevPAR) fell 54.8 percent to $47.75.
U.S. occupancy has risen week over week for 14 of the last 15 weeks, although growth in demand (i.e., room nights sold) has slowed, according to STR.

Top 25 Market Performance — July 19-25, 2020
For the week of July 19-25, aggregate data for the Top 25 Markets showed lower occupancy (40.8 percent) and ADR ($97.32) than all other markets.
Norfolk/Virginia Beach, Virginia, was the only one of those major markets to reach a 60 percent occupancy level (66.1 percent). Four additional markets reached or surpassed 50 percent occupancy: Detroit (55.2 percent); Atlanta (50.5 percent); Philadelphia-New Jersey (50.4 percent); and San Diego (50 percent).
Markets with the lowest occupancy levels for the week included Oahu Island, Hawaii (22.7 percent); New Orleans (28.3 percent); and Miami/Hialeah, Fla. (30.7 percent).
Of note, in New York occupancy was 36.3 percent—up slightly from 35.9 percent the week prior. In Seattle, occupancy increased to 35.1 percent from 34.2 percent the previous week.


