


Technology, online intermediaries, social media, revenue management software, shared services, and the proliferation of market intelligence reports have reshaped the way hotel sales and marketing departments conduct business. The traditional organizational structure of assigning personnel by demand segments (commercial, group, leisure) has given way to assignment by function (revenue management, social media, channel distribution, customer relationship management). According to one industry executive, most of the “selling” of hotel rooms has moved from the property level to corporate and regional offices.
These operational changes are evident when evaluating the expenses recorded within the sales and marketing department on a property’s operating statement. To gain a better understanding of how U.S. hotels are deploying their unit-level marketing dollars, we have examined the sales and marketing department expenses of a same-store sample of 3,461 properties during the years 2016 and 2017 (latest data available as of the writing of this article). The study sample consisted solely of hotels that have on-site sales and marketing personnel. Franchise-related fees and assessments were excluded from our analysis so we could focus exclusively on unit-level expenditures and tactics. In aggregate, the 3,461 properties averaged 233 rooms in size, with a 2017 occupancy of 75.7 percent and an average daily rate (ADR) of $181.15.
Variation by Property Type
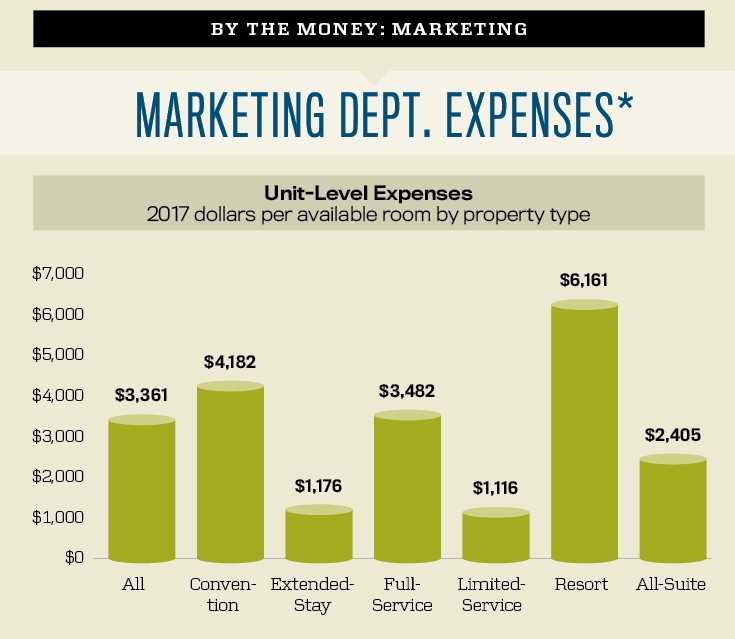
In 2017, the properties in our sample spent an average of $3,361 per available room (PAR) in the sales and marketing department, exclusive of franchise-related fees and assessments. Resorts spent the greatest amount on a PAR basis ($6,161), followed by convention hotels ($4,182). These two property types still originate the sale of most of their business from on-site marketing efforts. Limited-service ($1,116) and extended-stay hotels ($1,176) are more reliant on the brands and national corporate contracts to generate demand for their properties.
Our firm’s Trends in the Hotel Industry survey tracks 12 different non-franchise-related expense categories within the sales and marketing department. These include seven labor-related costs and five specific marketing expenditure categories.
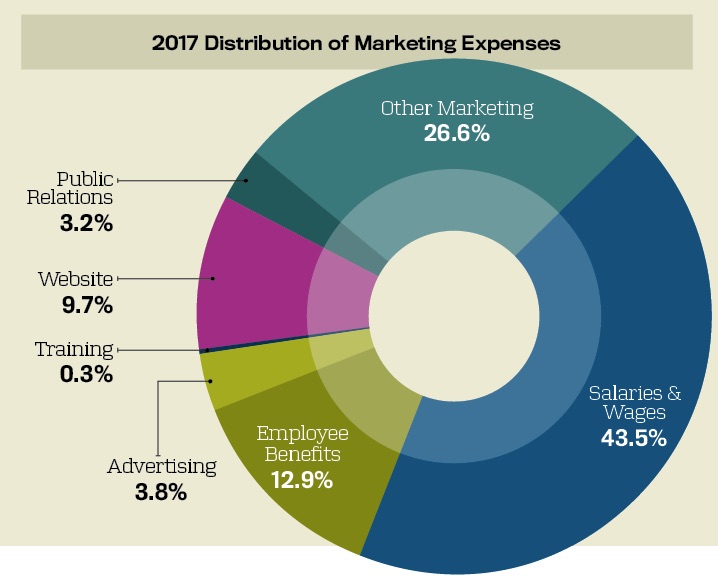
Despite the increased use of technology, the combined costs of salaries, wages, and employee benefits accounted for more than half (56.4 percent) of all sales and marketing department expenditures in 2017. Labor costs are the highest as a percentage of total department expenses at extended-stay (66.6 percent) and limited-service (61.6 percent) hotels. While the ratios appear to be high, these property types traditionally have an on-site marketing manager who is either a part-time employee or a shared-service resource. Labor costs as a percentage of total department expenses are lowest at convention (49.4 percent) and resort (52.3 percent) hotels. These low ratios can be attributed to the extensive dollars spent on other on-site marketing functions and tactics.
Website expenditures encompass 9.7 percent of total sales and marketing department expenses. Per the 11th edition of the Uniform System of Accounts for the Lodging Industry, this expense category records the costs associated with the development and maintenance of a hotel’s website, as well as functions such as responses to online reviews, search engine optimization, and e-commerce costs. This ratio is greatest at full-service hotels (13 percent) and lowest at extended-stay properties (3.5 percent).
Other discrete sales and marketing expenditures tracked by CBRE include advertising (3.8 percent of department expenses) and public relations (3.2 percent). Given the group orientation of convention hotels, this property category appears to be least dependent on advertising and public relations. Personal sales efforts are still more productive to capture group demand, as opposed to mass advertising or local public relations initiatives. Conversely, limited-service and resort hotels rely on advertising to reach dispersed transient leisure travelers.
Shifts in Investment
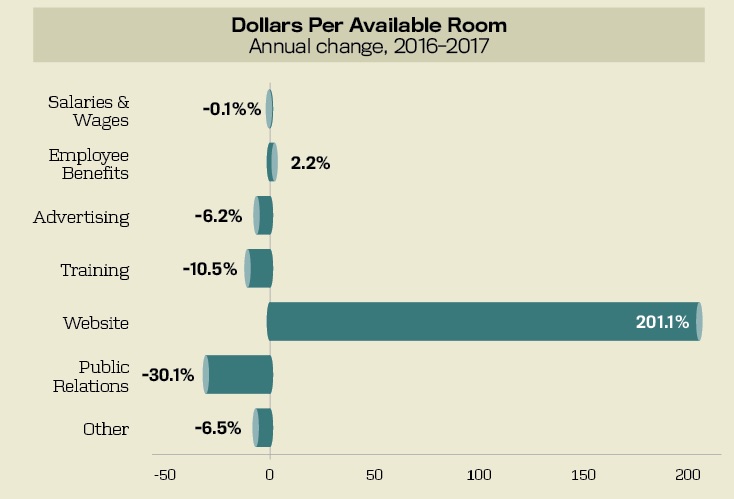
By evaluating the relative change in sales and marketing expenditures from 2016 to 2017, we clearly see where hotels are making investments and where they are cutting back.
From 2016 to 2017, the total non-franchise-related sales and marketing department expenditures for the study sample increased by 3.4 percent. This compares to a 1.6 percent rise in total operating revenue for the sample during the same period.
From 2016 to 2017, the total non-franchise-related sales and marketing department expenditures for the study sample increased by 3.4 percent.
Labor costs grew by just 0.4 percent from 2016 to 2017, but remain the largest expense within the sales and marketing department. It should be noted that the growth in labor costs was muted by a 2.6 percent decline in the number of bonus payments made during the year. This is consistent with the concurrent slowdown in the growth of revenue.
While the labor dollars have remained relatively flat, discussions with CBRE clients reveal a continued change in the profile and capabilities of on-site sales personnel. Today’s sales professionals need to possess the skills to use technology and software related to the internet, social media, revenue management, and channel distribution management systems.
While the 201 percent increase in website expenditures is distorted by the low dollar figures, we believe it is emblematic of the growing focus on reaching customers via the internet. Much of the costs associated with communicating with guests before, during, and after their stays is captured in the website category. Conversely, we observed a 6.2 percent decline in advertising expenses during 2017, along with a 30.1 percent drop in public relations costs. These two expense categories record traditional marketing tactics that are being replaced or updated by more efficient methods.
Efficiency
According to the September 2018 edition of CBRE’s Hotel Horizons forecast report, revenue per available room (RevPAR) growth is expected to range from 1 percent to 2.6 percent from 2019 through 2022. During this period, occupancy levels should remain near the record high of roughly 66 percent. This indicates that the demand for lodging will remain strong.
The challenge for sales and marketing professionals is to efficiently capture this demand at their hotels. Based on the story told by analyzing the expenditures within the sales and marketing department, this can be accomplished by a combination of enhanced technology and staffing with personnel able to leverage the technology.


 Acquires Pineapple Procurement")

