

According to the March 2019 edition of CBRE’s Hotel Horizons forecast report, the 2019 average annual occupancy level for U.S. hotels is projected to be 66.2 percent. This will mark the sixth consecutive year of occupancy levels above the 62.5 percent long-run average, and the fifth year above the pre-2014 historical high of 64.8 percent.
Despite such healthy market conditions, not all hotels are enjoying lofty levels of performance. According to STR, 35.7 percent of the hotels in their U.S. national sample achieved an occupancy level of less than 60 percent during 2018.
If you have attended any hotel investment conference or read the trade publications in the past five years, the focus of discussion has clearly been biased towards record occupancy levels and the highest profit margins since 1960. Very little attention has been paid to the over one-third of the U.S. lodging inventory that failed to “rise with the tide.” Yet, these 12,590 properties have owners who, like all others, seek a return on their investment.
To analyze the performance of these poor performers, we pulled operating statements from hotels in our Trends in the Hotel Industry database that achieved an occupancy level below 60 percent each year from 2007 through 2017. Seasonal properties were excluded from the sample. The majority of the poor-performing hotels were over 30 years old and categorized as economy and midscale properties. In 2017, the sample averaged 135 rooms in size, had an occupancy of 49.3 percent, and an average daily rate of $85.
The following summarizes the findings of our analysis. We compared the market performance of the poor-performing sample to the STR national sample, and the financial performance to the overall CBRE Trends sample.
Top-Line Deficiencies
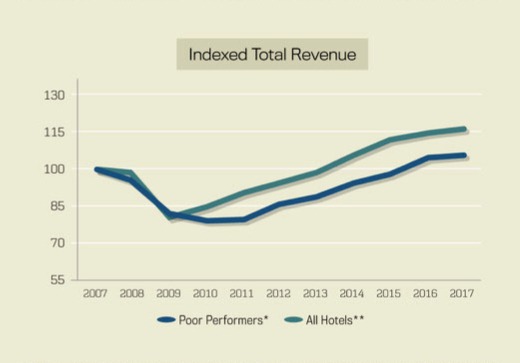
From 2007 to 2017, the hotels in the poor-performing sample achieved a RevPAR compound annual growth rate of just 0.7 percent. This compares to 2.5 percent for all hotels in the STR national sample. During this 11-year period, the occupancy rate for the poor performers declined from 51.5 percent in 2007 to 49.3 percent in 2017. Concurrently, the ADR for the sample increased at a CAGR of 1.1 percent, roughly half the national average.
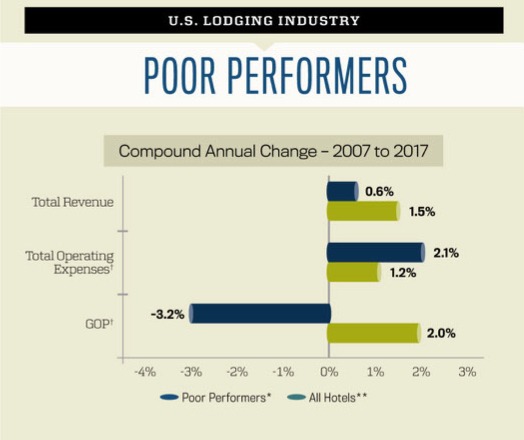
Rooms revenue comprised 80.2 percent of total revenue at the average poor-performing hotel in 2017. With RevPAR increasing at a CAGR of 0.7 percent the past 11 years, total revenue increased by just 0.6 percent. This implies a decline in the other sources of revenue from 2007 through 2017. The decline in contribution from food and beverage can be attributed to the conversion of some properties in the sample from full-service to limited-service hotels.
Expense Challenges
Not only have the poor performers been unable to enhance their market position, they have also struggled to control their expenses. From 2007 to 2017, operating expenses (before management fees and non-operating income and expenses) at the poor-performing properties increased at a CAGR of 2.1 percent. This compares unfavorably to the 1.2 percent CAGR of expense growth for all hotels in the CBRE Trends sample.
Unexpectedly, operational inefficiencies were not caused by excessive labor costs. Because of the lower revenue threshold, the combined payments made for salaries, wages, and benefits averaged 33.8 percent of total revenue at the poor performers over the past 11 years. This is just slightly above the 32.1 percent ratio at the overall Trends sample. From 2007 through 2017, the CAGR for labor cost for both samples was 1.6 percent, implying that the operators of the properties in both samples were equally adept at controlling labor costs.
The greatest growth rates for expenses occurred in the rooms and marketing departments of the poor performers. One can assume that operating in the lower-priced chain scales put pressure on these properties to offer complimentary food and beverage, an expense recorded in the rooms department. Further, the impact of rising franchise fees has a greater negative impact on properties that have been unable to keep pace with increases in revenue.
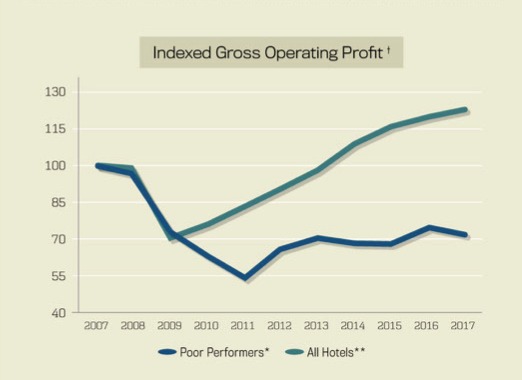
Bottom-Line Deficiencies
The combination of muted revenue growth and rising expenses has resulted in a decline in gross operating profits (GOP) from 2007 through 2017. During the period of analysis, the poor- performing hotels suffered a 3.2 percent compound annual decline in GOP. This compares unfavorably to the 2 percent CAGR increase in profits for the properties in the overall Trends sample.
Despite declining profits, the poor-performing hotels did achieve an average GOP margin of 27.1 percent during the past 11 years. While this is considerably less than the 35.8 percent margin for the overall sample, it does indicate that even poor-performing hotels do generate a cash flow from operations. Given the presence of a cash flow, this does allow for the possibility of a return on investment. The key is to purchase poor-performing hotels at an appropriate price, and then finance the acquisition accordingly.