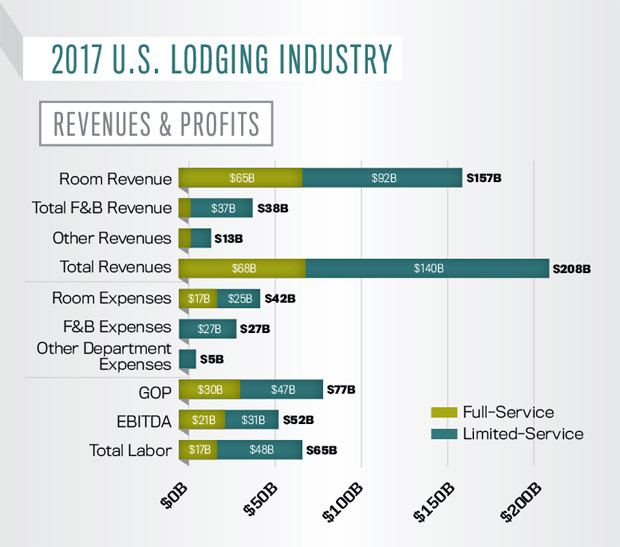
For several years, STR has produced an estimate of total revenues and gross operating profit for the U.S. lodging industry. For 2016, we reported an estimated $199 billion in total industry revenues. These estimates were developed by extrapolating HOST P&L operating ratios across the entire United States, based on chain scale and service level. However, last year we set out to develop a more robust model for the industry by modeling P&L data for every U.S. hotel.
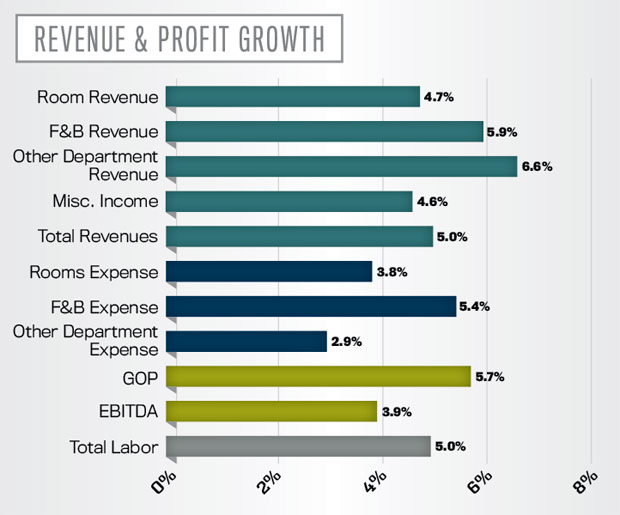
Using this modeled data, we estimate 2017 total revenues for the U.S. of $208 billion (5 percent increase), with $140 billion coming from the 13,000 full-service hotels. Gross operating profit topped $77 billion (5.7 percent increase) in 2017, while 61 percent of profits came from full-service hotels. These figures are once again all-time highs for the industry. Note that these year-over-year growth figures include the 1.8 percent supply growth for the United States in 2017.
Our primary goal in modeling HOST data was to model P&L data for every U.S. hotel. To accomplish this, we leveraged all of STR’s data sources, including STAR rooms revenues and additional revenues data, segmentation data, F&B STAR data, and HOST P&L data, among others. Pulling all of these data sources together, we recognized that we are already collecting 75 percent of total industry revenues for the United States. Using all of this actual data—including P&L data for 9,000 hotels worldwide annually and over 15,000 U.S. hotels since the HOST program began—gives us a considerable database of P&L data to analyze. Combining all of these data sources with the census database, we can determine typical operating ratios for hotels based on class, service level, room count, meeting space, market, amenities, and various other criteria.
Our new modeling methodology also allows us to examine departmental revenues and expenses. We estimate total F&B revenues of $38 billion, other department revenues of $7 billion, and miscellaneous income of $6 billion. Of the $38 billion in F&B revenues, $15 billion comes from upper-upscale hotels and $10 billion comes from luxury hotels. The largest 2017 increase in revenues came from other operated department revenues (6.6 percent).
The rooms and F&B departments totaled expenses of $42 billion and $27 billion, respectively. Total labor costs for the industry are estimated to be $65 billion for 2017, with $48 billion coming from full-service hotels. In examining labor costs by class, $19 billion came from the upper-upscale class, $13 billion from the luxury class, and another $12 billion from the upscale class. Labor costs grew at the same rate as total revenues for the industry (5 percent) in 2017. The growth in labor costs continues to be a major concern for the industry, as new legislation and increasing scarcity of qualified labor continue to have a significant impact.


About the Author
Joseph Rael is director of financial performance for STR.


