As we enter 2020, messages and performance studies through 2019 include comments about how the lodging industry is slowing down and predictions of hard times ahead. Therefore, it is interesting to identify and examine STR’s Top 25 U.S. Markets and understand how they trend and measure versus the rest of the U.S. lodging industry as a whole.
STR’s Top 25 Markets are the largest of the STR-defined U.S. markets, accounting for approximately 32 percent of hotel rooms across the country. Historically, these 25 markets outperform the remaining 143 U.S. markets in absolute values.
When reviewing 2019 third-quarter results for the Top 25, the RevPAR percent change versus the previous year (2018), there was a 0.3 percent decline—or a 38 percent drop—landing at $117.23 of RevPAR. To serve as a reminder, 2018 year-end (YE) RevPAR grew 2.5 percent over 2017.
One data point that keeps growing consistently is the number of new rooms coming into the Top 25 markets. When reviewing the data composition that makes up for the RevPAR, occupancy results triggered the negative percent change mentioned earlier, so understanding supply change is key. Using the total U.S. number as a baseline for market growth, it needs to be pointed out that 15 markets are trending above this number, with Nashville, Tenn., and Denver, Colo., showing change above 7 percent over the same period last year.
Strongest year-over-year (YOY) performance recorded year-to-date from these select markets is Atlanta, Ga., gaining a 4.6 percent on its ADR, situating this key performance indicator at $116.45, which is still $137.32 less than the metric recorded in the top ADR performing market of San Francisco-San Mateo, Calif., (currently at $253.77), which is, yet again, another reminder of the large range of performance indicators just within these 25 markets. A combination of weak occupancy and ADR has left Seattle, Wash., ranked last, losing 4.1 percent over last year in RevPAR, influenced by the supply growth recorded, and causing the rate to struggle as this market absorbs the new inventory.
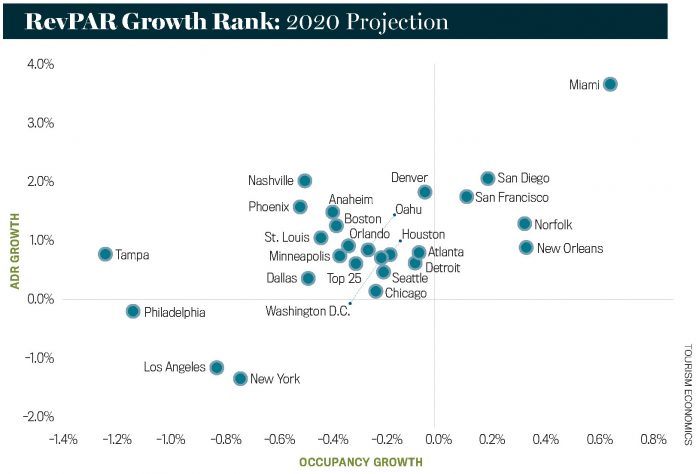
As to forecast performance for the Top 25 Markets, YE 2020, the STR forecasting department plot Miami-Hialeah, Fla., to come out on top. This is due to a slowing of new construction entering that market, along with major events like the next Super Bowl (54th Edition) to be held there. With a RevPAR growth above 4 percent forecasted, the dollar amount of this metric is estimated to be close to $155, gaining a full $6 over 2019. San Francisco-San Mateo, Calif., remains on top of this list, as the conference lodging or group business is still strong with the reopening of the Moscone Centre.
To identify an average with these 25 Top Markets, a total number was created where the performance forecasted shows a slight dip in occupancy, to still hold rate, resulting in a flat to slight growth in RevPAR. Finally, to cover the markets in this category that are forecasted to have a weak YOY performance, the surprisingly weak ADR in the markets of New York and Los Angeles-Long Beach are the main cause for the listed prediction. This goes along with the supply change happening, especially in New York, which is struggling to absorb the new rooms entering the market, as well as weak demand.


