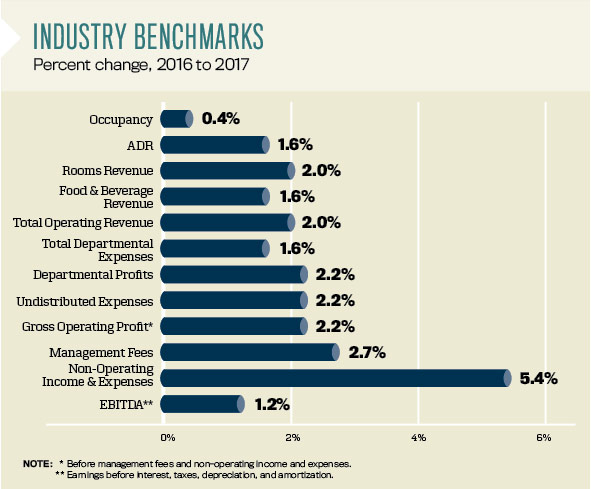
U.S. hoteliers enjoyed an eighth consecutive year of increasing profits in 2017, despite another slowdown in the rate of revenue growth. According to the 2018 edition of Trends in the Hotel Industry, total operating revenue increased by 2 percent in 2017 for the average hotel in its survey sample. Fortunately, by limiting the growth in operating expenses to 1.9 percent, managers at the Trends properties realized a 2.2 percent increase in gross operating profits (GOP) for the year.
Trends in the Hotel Industry is the CBRE Hotels’ Americas Research’s annual survey of operating statements from thousands of hotels across the nation. The 2017 operating data collected for the 2018 survey was compiled in accordance with the 11th edition of the Uniform System of Accounts for the Lodging Industry.
It is becoming increasingly difficult for U.S. hotels to achieve both revenue and profit gains. Within the 2018 Trends sample, only 59.1 percent of the properties enjoyed an increase in total operating revenue in 2017, while just 52.3 percent attained growth in profits. These are the lowest levels observed since the depths of the recession in 2009. Increasing competition from new supply, muted growth in average daily rates (ADR), and upward pressure on labor costs make the current operating environment one of the most challenging since the Trends survey started tracking industry performance in the 1930s.
Efficient & Productive
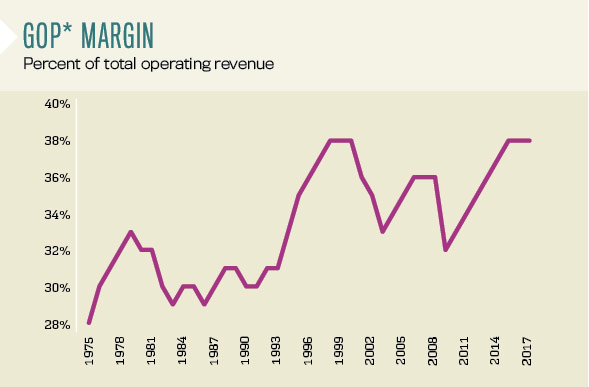
Over the years, U.S. hoteliers have been able to effectively respond to difficult operating conditions. By matching the 2 percent gain in revenue with a stingy 1.9 percent rise in expenses, the GOP margin for the Trends sample increased to 38.3 percent in 2017. This is the highest profit margin recorded by CBRE since 1960 and is an indication of superlative operating efficiencies and productivity.
U.S. hoteliers continue to effectively manage labor costs, the largest expense for hotels. The labor market is very tight, especially in the leisure and hospitality industry. According to the Bureau of Labor Statistics (BLS), the current level of open jobs in the sector equates to 5.3 percent of the total personnel currently employed. This is the highest level since 2000 and is indicative of the difficulty hospitality managers are having finding qualified employees.
The tight labor market has put upward pressure on industry wage rates. Per BLS, the average hourly compensation rate for hospitality employees rose 3.8 percent in 2017. For the hotels in the Trends sample, total labor costs (salaries, wages, and benefits) increased by 1.8 percent. This implies a reduction in the number of hours worked. In addition to controlling the schedule, hotel managers gained greater productivity from their staff. With fewer hours, the employees at these same hotels serviced 0.4 percent more occupied rooms, as well as greater volumes of food and beverage revenue.

Overhead Concerns
While labor costs continue to be controlled, an increase in non–labor-related expenses was observed in 2017. During the year, labor costs increased by 1.8 percent, and all other costs rose by 2 percent. Some of the greatest increases were observed in the undistributed departments, where, in aggregate, expenses grew by 2.2 percent. Compared to the operated departments, undistributed costs are relatively fixed in nature and therefore less controllable by management.
The most obvious cost increase among the undistributed departments during 2017 was utilities, which grew by 1.4 percent. The 1.4 percent growth rate is not an alarming increase, but this is the first time since 2013 U.S. hoteliers have not benefited from a decline in utility costs.
There were some non–labor-related costs that rose more than revenue in 2017. These include technology-related expenditures, franchise fees, credit card commissions, and the cost of complimentary food, beverage, and services. Below GOP, management fees and property taxes also increased at a greater pace than the 2 percent growth in revenues.
Property owners did find some solace in the 4.2 percent insurance costs decline in 2017. However, given the number of natural disasters that occurred during the year and the sluggish start to the stock market in 2018, we may see a boost in premiums this year.
Moving Parts
During 2017, operators of resort and convention hotels were the most efficient in generating revenue flow-through to the bottom line. These two property types were the only ones to achieve GOP growth greater than revenue growth during the year. Resorts and convention hotels are typically large operations with extensive services, amenities, and labor requirements, therefore providing managers with more “moving parts” to control.
Conversely, limited-service hotels by design provide fewer amenities and services, and thus require fewer employees. Accordingly, managers at limited-service properties have fewer options for cost reductions, especially when operating above long-run average occupancy levels. In 2017, limited-service hotels were the only property type to suffer a decline in GOP from 2016 levels.
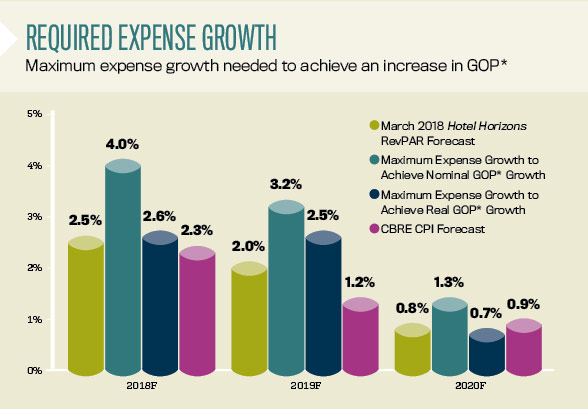
According to the March 2018 edition of CBRE’s Hotel Horizons forecast report, annual RevPAR gains for U.S. hotels are projected to range from 0.8 percent to 2.5 percent from 2018 through 2020. Given this rate of revenue expansion, can hotels continue to achieve profit growth? For hotels to achieve profit growth that keeps pace with inflation, expense growth must be limited to 2.6 percent or less over the next few years. Keeping in mind that the annual average expense growth rate since 1960 is 4 percent, this will be an enormous challenge.
It is a very interesting period for hotel owners. On the one hand, hotels are achieving record-level profit margins, and it therefore can be assumed that owners and investors are currently receiving strong returns on their investments. On the other hand, while profit growth appears to be durable, owners like a “growth story.” Slow growth in profits make the future story a little less exciting.


About the Author
Robert Mandelbaum is Director of Research
Information Services for CBRE Hotels’ Americas Research.


