

While hotel industry revenues and profits are rising, guest satisfaction is declining. According to the J.D. Power 2022 North America Hotel Guest Satisfaction Index Study, the increase in industry fundamentals has not been met with a corresponding improvement in guests’ perceptions of amenities or services. One of the areas of greatest disappointment is the quality of the guestrooms and facilities. While guests appreciate the enhanced cleanliness prompted by COVID-19, scores for décor and furnishings, in-room amenities, and the quality of bathrooms declined from June 2021 to May 2022. Managers needed to cut costs in the property operation and maintenance (POM) department during 2020 and control the increase in 2021, as they had to do with all other departments. This initiative, in turn, contributed to the appearance of deferred maintenance and resulting decline in guest satisfaction.
To gain a better understanding of recent trends in maintenance expenditures within U.S. hotels, CBRE analyzed the POM department costs of 2,900 properties that participated in our annual Trends in the Hotel Industry survey each year from 2015 through 2021. Last year, these 2,900 hotels averaged 209 rooms in size and achieved an occupancy of 54.2 percent along with a $152.70 average daily rate (ADR).
POM Expense Categories
Within the POM department, CBRE captures the following three broad expense categories:
- Labor Costs and Related Expenses: The salaries, wages, bonuses, and employee benefits for the chief engineer, maintenance department staff, and contracted staff.
Contract Services: Activities performed by third-party vendors. Typically, these include such services as pest control, elevator/escalator maintenance, waste removal, landscaping, and life/safety. - Maintenance Expenses: Costs associated with the direct performance of duties by hotel maintenance personnel. This includes the cost of parts and equipment needed for the routine maintenance of items such as floor coverings, electrical and mechanical equipment, kitchen equipment, furniture, fixtures, painting/wall coverings, and plumbing.
Not included in the POM department are capital expenditures for major renovation projects and property improvement plans or the purchase of equipment that can be capitalized.
Cut, But Not Abolished
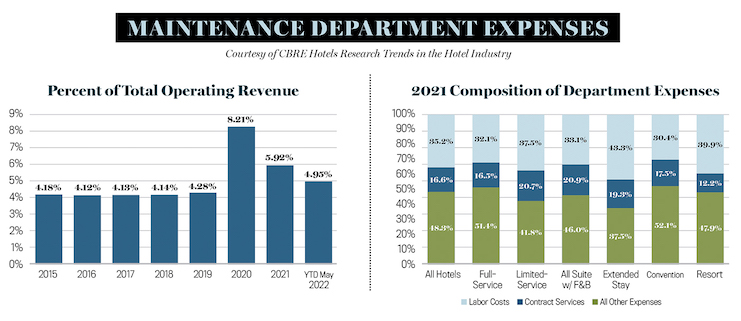
In 2020, POM expenditures at the hotels in our study sample were cut by 30.8 percent. However, this was a relatively limited decline compared with the 50 percent decrease in occupied rooms and 63.9 percent falloff in total hotel revenue during the year. With expenditures declining less than revenue, POM expenditures jumped to 8.2 percent of total revenue in 2020. This is almost double the average department expense ratio of the previous five years.
Since 2020, maintenance department expenditures have increased by 5.9 percent in 2021 and 5 percent through May of 2022. At this pace, 2022 POM department expenses are on track to surpass 2019 levels. In fact, POM expenses at limited-service and extended-stay hotels returned to pre-COVID levels in 2021, which mirrors their quicker pace of occupancy recovery.
During the dark days of 2020, when most hotels either essentially shut down, or were mostly unoccupied even though open for business, POM expenses were still incurred. Given that most hotel shutdowns were anticipated to be temporary during the height of COVID-19, hoteliers needed to preserve the buildings for reopening. Therefore, they still incurred expenses, primarily in labor to have an engineer present most of the time, if not 24/7, for security purposes, flowing water through building systems, etc., as well as for essential routine upkeep such as fixing leaks, security systems and equipment, and HVAC. Additionally, once COVID-19 was determined to be transmissible via air, most hotels upgraded their HVAC filters to MERV-13 or higher and made other air-quality improvements at an added expense.
To the extent that funding was available, many property owners and management companies capitalized on the opportunity presented by the empty guestrooms and public spaces to catch up on preventative maintenance rotations and other projects. Not only was this work able to be completed more efficiently with the spaces being unoccupied, but there was also at least one member of the engineering team on staff who could be completing the work while overseeing the building.
POM Labor
From 2015 through 2021, labor costs within the POM department averaged 50 percent of total department expenses, even during 2020 and 2021. In 2021, labor costs as a percent of department expenses were greatest at full-service, convention, and resort hotels. Not only do these property categories typically have higher room counts, but they also offer a greater degree of services and amenities that require maintenance. Conversely, this ratio was lowest at extended-stay and limited-service properties. These properties frequently use part-time labor or maintenance staffing shared with nearby properties under common ownership/management.
Being the largest expense category, labor costs were cut the most in 2020. Non-management personnel suffered the most, as hoteliers used available labor funds to retain their management-level staff, who are more valuable and more difficult to replace. Comparing the composition of labor costs between 2015 and 2021, we see a slight increase in the use of contracted labor, and an increase in bonus pay, which may reflect incentive payments needed to attract and retain employees. While not as severe as the housekeeping labor shortage, hotels are struggling to attract and retain engineering and maintenance staff, causing them to utilize contract labor in this department, which was not needed in the past.
A Fixed Expense
Historically, POM expenses have been viewed as mostly a fixed expense to provide a minimum level of maintenance to preserve the physical asset and guest satisfaction. The relative change in maintenance department expenditures on a per-available-room basis (PAR) versus per-occupied-room basis (POR) from 2015 through 2021 confirms this theory. From 2015 through 2021, total POM department expenses measured on a PAR basis declined on average by 1.8 percent on a compound annual basis. Concurrently, the compound annual growth rate for POM expenses on a POR basis was 3.8 percent. Labor costs appear to be slightly more variable than contract services and other expenses.
The Need to Maintain Maintenance
Hotel owners typically set aside a percent of profits in a capital reserve to pay for periodic major renovation projects. In 2020, many hotel owners had to tap into their capital reserves to pay debt service. Unfortunately, for these same owners, hotel profits were still 30 percent below 2019 levels as of May 2022, thus limiting their ability to replenish the reserve. Depleted reserves make it a challenge to perform major renovations. This further emphasizes the need to maintain the POM department expense to provide repairs on a day-to-day basis. As noted by the results of the JD Power survey, maintenance of the physical facility is needed to preserve guest satisfaction and justify the current growth in ADR.