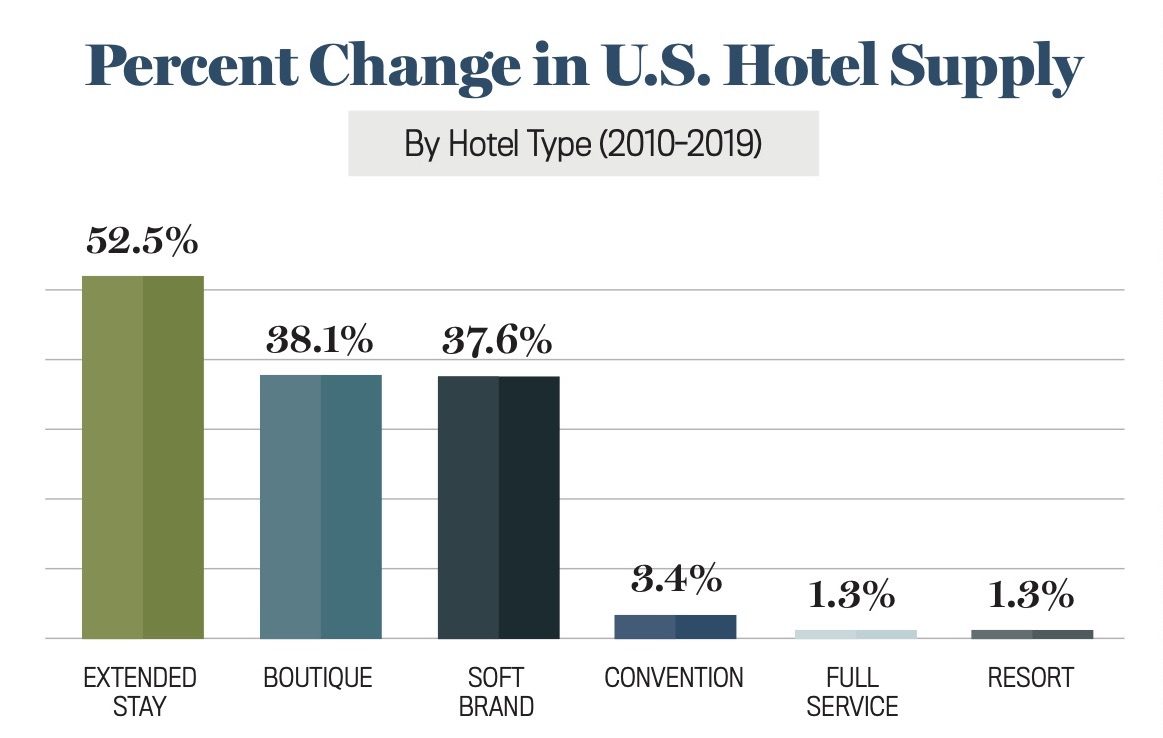
Extended-stay hotels are rounding a decade of unprecedented growth in the United States. Over the past 10 years, extended-stay supply has grown at a rate of 5.3 percent annually, not only outpacing the annualized supply growth rate of 1.1 percent for all hotels, but also higher than the growth rate for any other hotel type. A key force driving this emergence in extended-stay supply is favorable demographic tailwinds.
Catering to a unique set of customers—from business travelers in town for training to households relocating to a new area for work—extended-stay hotels have historically found strength in suburban submarkets, often in close proximity to office parks. In fact, in 2000, 75 percent of extended-stay supply was found in suburban locations. Today, however, that number has dropped to 62 percent. So, where is the supply shifting? It’s following the worker.
As many markets across the country experience a suburban-to-urban shift, the extended-stay model is not only riding this demographic undercurrent, it is thriving in many submarkets outside of its traditional suburban strongholds.
Over the past 10 years, extended-stay supply has grown at a rate of 5.3 percent annually.
The trajectory of growth in this sector has dialed into key demographic trends that underscore the need for this product in which guests stay, on average, between four and seven days or longer. The strength and growth of a submarket’s labor force, defined by income and labor force participation, are two themes that can lend a greater understanding of supply and performance trends.
Not surprising is that supply growth is gravitating toward the urban core. From 2010 to 2019, for the top 25 U.S. markets, extended-stay supply growth within three miles of the city center has grown at nearly twice the annual rate (10.3 percent) of overall extended-stay supply growth (5.3 percent). However, there is a broader demographic theme that helps explain the shifting supply of extended-stay hotels.

By analyzing these basic demographic trends to characterize all 650 STR submarkets, we can get a better grasp of the types of submarkets to which extended-stay supply is gravitating and the type of performance that can generally be expected in areas with varying socioeconomic conditions.
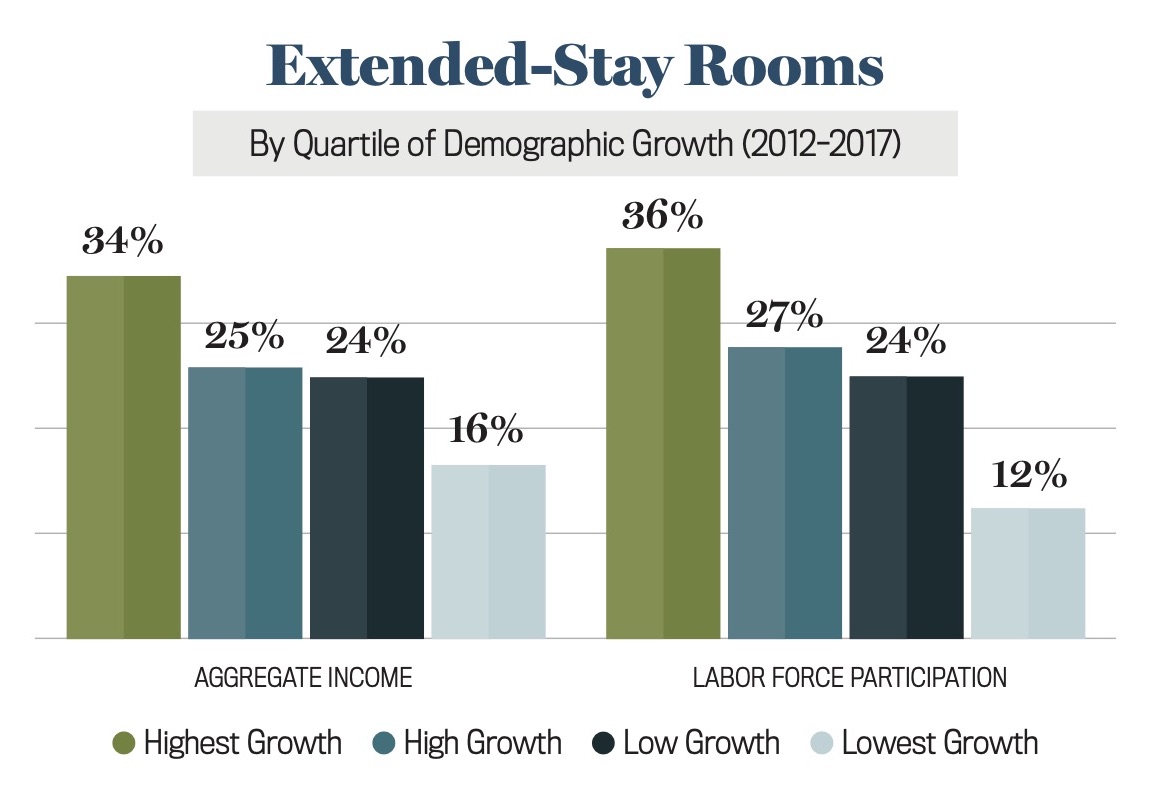
Defining each submarket in terms of its percent change in income and percent change in labor force participation from 2012 to 2017 (the most recent data available from the U.S. Census Bureau), and then organizing all submarkets into quartiles—ranked from highest growth to lowest growth—two key trends emerge.

First, extended-stay supply is primarily located in submarkets where income and labor force participation have increased the most. To that end, extended-stay supply is much less prevalent in areas where these demographic trends had the lowest rates of growth.
Second, occupancy and average daily rate (ADR) are higher in submarkets where labor force participation is highest. Occupancy is 4 percent higher, and ADR nearly 18.7 percent higher in the submarkets with the highest growth, compared to those with the lowest growth.
Overall, as supply grows into new submarkets and reaches new demographics, it appears that the extended-stay supply is adapting well to current trends and producing comparatively higher occupancy and ADR in areas with more favorable demographic tailwinds.


