

Through the third quarter of 2023, the U.S. hotel industry showed some continuation of profitability trends as well as new developments in the data that aligned with the start of corporate travel season.
Margins are being pressured. With the overall demand mix and topline performance normalizing, year-over-year growth rates are weakening. At the same time, expenses continue to grow with total operating expenses per available room (TOEPAR) increasing roughly 1 percent from month to month. With that combination, GOP (from 37.2 percent to 36.4 percent) and EBIDTA (from 26.3 percent to 25.4 percent) margins were down headed into Q4.
Labor costs reflect normalizing business mix. Labor per available room (LPAR) came in at $72.47 in September, which was higher than the summer months and up 4.5 percent year over year. The higher overall labor cost, combined with lower demand, shows a normalizing business mix with leisure travel subsiding and corporate season headed toward its peak.
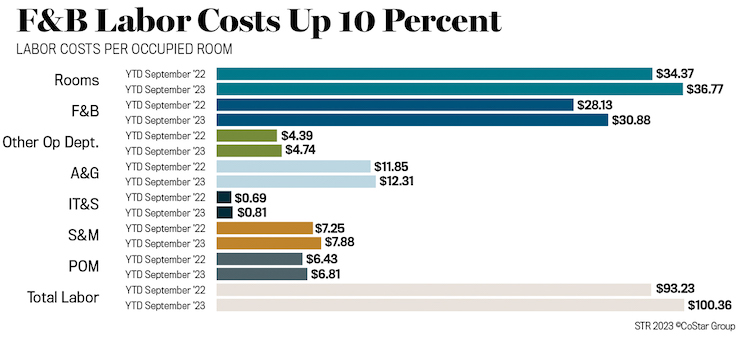
Unlike revenue metrics, which have wobbled month to month, growth in LPAR has remained consistent. Switching to a per-occupied-room (POR) basis, labor costs increased 7.6 percent year over year through the first three quarters of the year. F&B labor costs (POR) showed the largest year-to-date growth (+9.8 percent) of any department, which reflects the improvement in group business and aligns with weekday groups lifting the topline. Another sign of the return of corporate demand and groups, catering and banquet revenues were up 20 percent from the first three quarters of last year.
Most markets are improving their bottom line. New York City’s performance recovery has been on full display in the topline metrics this year. Year-to-date profitability metrics reflect the Big Apple’s momentum as well. Among the country’s largest hotel markets, New York City and Oahu Island posted the largest gains in GOPPAR through the first nine months of the year. Overall, 13 of the Top 25 Markets posted double-digit growth in gross operating profit per available room (GOPPAR). Miami, Anaheim, and Los Angeles are the markets significantly underperforming last year’s GOPPAR levels. Anaheim and Miami can attribute part of the decline to lower revenues, whereas Los Angeles’ decline is strictly on higher expenses.
Upper upscale is the name of the game this year. Upper-upscale chains continue to lead the rebound in year-over-year growth, with double-digit gains in TRevPAR and GOPPAR. Concurrently, GOPPAR for luxury chains has fallen this year.
Independent was the other scale with lower GOPPAR through the first three quarters. These properties tend to have more flexibility in revenue strategies and typically post higher ADR and RevPAR than full-service hotels or other branded hotels of a similar class level. Since independents pay lower fees than a brand (or none at all), they tend to post higher profits, but also show lower profit margins because they may not have the same level of efficiency in their systems.