


The number of soft-branded hotels has risen dramatically over the last decade, growing from just two brands and 22 properties in 2010 to 12 brands and 362 properties in 2018. With such significant growth, it’s worth exploring how soft brands compare in performance to both their independent and traditional “hard”-branded counterparts. STR defines a soft brand as a collection of hotels that allows owners and operators to affiliate with a major chain while retaining their unique name, design, and orientation. Although soft brands now exist across all chain scales, with new entrants from Best Western, Wyndham, and Red Roof, this analysis focuses on the more established upscale, upper-upscale, and luxury soft brands and how they compare to the independents and hard brands of the same classes.
With what seems like a new soft brand launch happening every few months, it’s not surprising that the soft-brand category boasts an impressive 28.8 percent supply compound annual growth rate (CAGR) from 2014-2017. Over this same time period, hard brands saw a 4.5 percent supply CAGR, and independents experienced the lowest growth at 4.1 percent. This growth in soft-brand supply is likely to continue over the next few years, with 115 soft-branded properties representing 16,062 rooms currently in the pipeline of new-build construction. As of July 2018, only 17 percent of soft-branded properties were new-builds, so it is likely that existing properties will continue to be converted to soft brands.
28.8%
The soft-brand category boasts an impressive 28.8 percent supply CAGR from 2014-2017.
For four consecutive years, soft brands have outperformed in occupancy, average daily rate (ADR), and revenue per available room (RevPAR) when compared to both hard brands and independents in the upscale, upper-upscale, and luxury classes. The largest disparity is in ADR, where soft brands command a 30.4 percent rate premium over traditional branded properties. Although these current key performance indicators are strong, occupancy and rates have declined for soft brands since their peak in 2015, with an occupancy of 73.1 percent and an ADR of $218.70. A shift in the soft-brand segment composition doesn’t appear to be the root cause of this rate decline, as upper-upscale and luxury classes represent a larger percentage of rooms than they did in 2014.
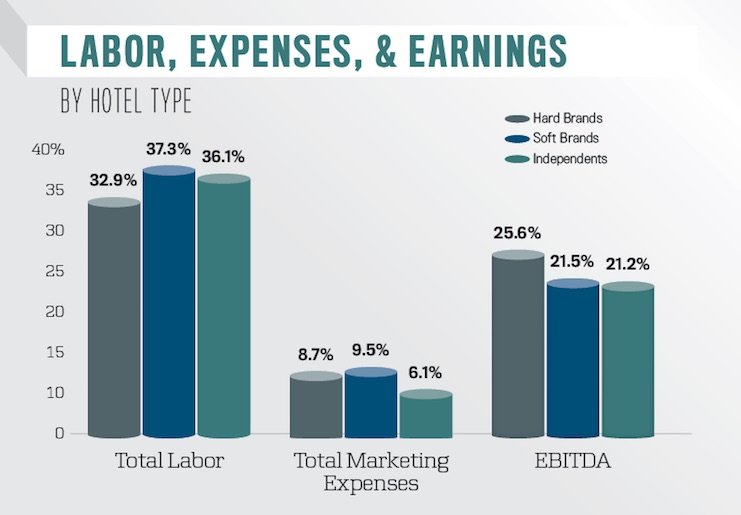
Although soft brands beat out hard brands in occupancy and ADR in 2017, hard brands were able to achieve higher earnings before interest, taxes, depreciation, and amortization (EBITDA) margin. In that metric, soft brands more closely resembled independents, with a 21.5 percent EBITDA margin, just slightly higher than independents’ 21.2 percent. Soft brands had the highest marketing expenses as a percentage of total revenues in 2017 at 9.5 percent. The inclusion of franchise fees puts them 3.4 percent higher than independents, and it would be expected that soft brands would have higher marketing spends than more established hard brands as they continue to build brand awareness.
As soft brands continue to grow in popularity, we’ll be keeping an eye on the segment to see how the performance data is able to grow on already strong performance.


