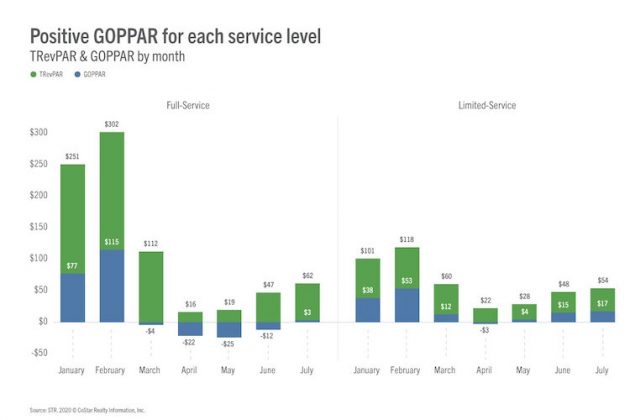
BROOMFIELD, Colorado—U.S. hotel gross operating profit per available room (GOPPAR) reached positive territory for the first time since February, according to STR’s latest monthly P&L data release. In a year-over-year comparison with July 2019, the industry reported a 93.3 percent decline in GOPPAR to $5.74 in July 2020.
STR also reported that year over year in July 2020, total revenue per available room (TRevPAR) fell 74.1 percent to $60.04; earnings before interest, income tax, depreciation, and amortization per available room (EBITDA PAR) declined 115.1 percent to -$9.24; and labor costs per available room (LPAR) dropped 64.8 percent to $28.46.
U.S. Hotel Monthly P&L Data
July 2020 vs. July 2019
GOPPAR: -93.3% to $5.74
TRevPAR: -74.1% to $60.04
EBITDA PAR: -115.1% to -$9.24
LPAR: -64.8% to $28.46
The industry had registered negative GOPPAR values for four consecutive months: March (-$2.10), April (-$17.98), May (-$10.26), and June (-$5.89).
“As the industry inched closer to 50 percent occupancy, we saw continued incremental improvement in the subsequent profitability metrics,” said Raquel Ortiz, STR’s assistant director of financial performance. “We are of course nowhere near pre-pandemic levels, but there were additional encouraging signs in positive GOPPAR for full-service hotels and six major markets.”


This improvement is only for open and reporting hotels correct? The positive trend is great to see, however, with major markets (DC, BYC, BOS) still showing more than 15% of the total inventory offline, is this result misleading? Are we nearing 50% occupancy based on the same contributing sets or only current operating sets as there could be a major disconnect with that data.
Jeff — Thank you for your comment. We reached out to STR to confirm: The P&L data is based on open hotels, as is the occupancy figured cited. To measure performance based on all properties in a market as opposed to only those that can be booked, STR recently launched the Total-Room-Inventory (TRI) methodology. According to STR, U.S. occupancy was 47 percent in July using standard methodology and 44.6 percent using TRI. STR noted that most major markets show a similar occupancy range between the two methodologies. More information on this methodology can be found here: https://str.com/data-insights-blog/tale-two-occupancies-total-room-inventory-vs-str-standard