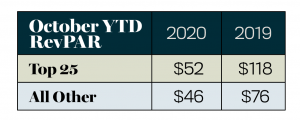
STR’s Top 25 Markets are the largest of the STR-defined U.S. markets. In 2019, they accounted for one-third of all the available rooms in the United States. Historically, these 25 markets have outperformed the remaining 143 U.S. markets in both performance and profitability; however, the COVID-19 pandemic has altered that dynamic. In 2019, the Top 25 year-end RevPAR was $115.76, about $43 higher than the rest of the market, which had a RevPAR of $72.90. However, by October 2020, the YTD RevPAR differential had narrowed to just $6, with Top 25 YTD RevPAR falling to $51.85, a 56 percent decrease from the previous year.
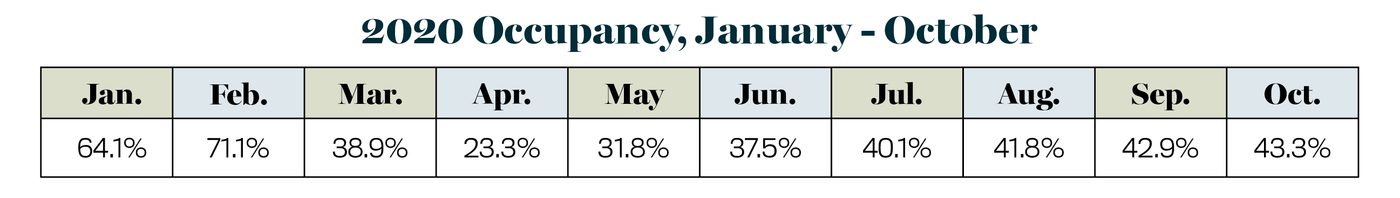
The Top 25 has been hit disproportionately hard by COVID-19 for several reasons; one of the leading factors has to do with the supply make-up of these markets. According to STR, 50 percent of all luxury and upper-upscale properties in the United States are located in a Top 25 Market and these two classes saw the largest percent decrease in RevPAR since March. These properties, and therefore the Top 25 Markets, are dependent on having a healthy segmentation mix, anchored by a consistent influx of group demand (rooms sold in a block of 10 or more). In 2019, the group occupancy for the Top 25 was 23 percent, but by October 2020 the YTD group occupancy had fallen to only 8.5 percent, a 64.5 percent decrease from the previous year. That, coupled with a lack of transient demand (rooms sold in a block less than 10), resulted in the Top 25 YTD occupancy decreasing from nearly 75 percent to only 44.2 percent in October. While the Top 25 monthly occupancy has grown month-over-month for the last six months, it bottomed out in April 2020 at 23.3 percent. Further, in that same month, RevPAR declined by 85 percent to $18.56, the lowest it has ever been to date.
With all of the international travel restrictions due to COVID-19, there were less than 500,000 total international arrivals to the United States between April and September 2020.
Another factor hurting Top 25 performance, specifically for the coastal markets of San Francisco, Los Angeles, Seattle, Boston, New York City, and Philadelphia, is the disappearance of international arrivals to the United States. Prior to March 2020, between two and four million international visitors would come to United States each month, many of them traveling to a Top 25 Market. But, with all of the international travel restrictions due to COVID-19, there were less than 500,000 total international arrivals to the United States between April and September 2020.
The Top 25 Markets’ struggles haven’t been limited to top-line performance. In fact, in 2020, the 143 markets not included in the Top 25 were more profitable than their Top 25 counterparts. In October 2020, the YTD GOPPAR (gross operating profit per available room) for a non-Top 25 Market ($28.31) was more than twice that of the Top 25 ($12.69) with the lack of group demand again being a factor. Because of this, five Top 25 Markets (Chicago, Minneapolis, New York City, Seattle, St Louis) had a negative GOPPAR, with the New York City market posting a YTD GOPPAR of -$30.
With international travel and group business expected to return in Q3 of 2021, the U.S. Top 25 Markets’ recovery will be gradual. It will take time for the ADR growth to mirror the demand growth we will see in 2021. However, the Top 25 Markets are poised to reclaim their spot as some of the highest performing global markets in the coming years.