

STR’s Top 25 Markets are the largest of the STR-defined U.S. markets, accounting for approximately 32 percent of hotel rooms across the country. Historically, these 25 markets outperform the remaining 143 U.S. markets in absolute values, and over the last year, they also outperformed the others when it came to year-over-year comparisons. Revenue per available room (RevPAR) within the Top 25 Markets ($116.32) increased 3.3 percent over the last 12 months, outpacing the 3 percent rate of growth seen in all other markets ($71.36). While often the beneficiary of consistent demand, Top 25 RevPAR can also be attributed to strong increases in average daily rate (ADR), as occupancy remains relatively flat.
Top 25 ADR for the last 12 months checked in at $157.59, which was more than $43 higher than the aggregate of all other markets. That absolute value of just under $158 was 2.8 percent higher than the previous 12 months and 50 basis points higher than all other markets, which grew at 2.2 percent from October 2017 through October 2018.
The Top 25 Markets combined make up 44 percent of total U.S. rooms revenue.
The ADR range within the Top 25 Markets is tremendous. New York City, San Francisco/San Mateo, and Oahu Island led the group with room rates ranging between $261 and $237, while the bottom three markets—St. Louis, Detroit, and Norfolk/Virginia Beach—ranged between $105 and $102.
On the room revenue front, all of the key markets exhibited high growth rates over the last 12 months. The Top 25 Markets posted 6 percent growth, while all other markets increased revenues 4.8 percent. New York City, Los Angeles/Long Beach, and Washington, D.C., achieved the highest room revenues, which accounted for more than 28 percent of the total room revenues in the Top 25 Markets. The Top 25 Markets combined make up 44 percent of total U.S. rooms revenue.
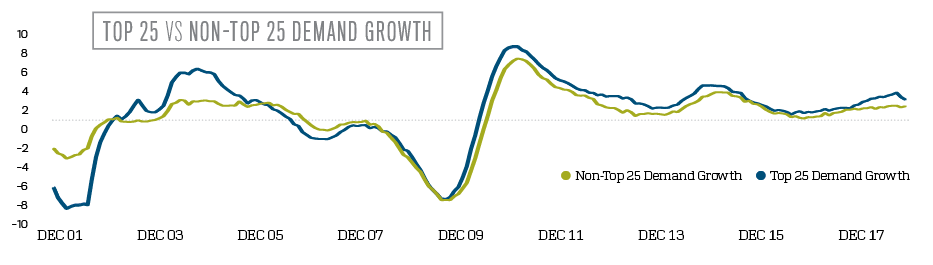
The pricing power we see in the Top 25 Markets follows high demand growth. Room nights sold (demand) in the top markets grew at 3.2 percent, while all other markets increased 2.5 percent. As previously mentioned, occupancy has stayed mostly flat within the Top 25 Markets, growing at a rate of 0.5 percent with pressure from fairly significant supply growth. But absolute occupancy in Top 25 Markets is nearly 74 percent, while other markets sold less than 63 percent of rooms available.
Supply growth for the top markets has surpassed that of all other markets at a 2.6 percent growth rate, nearly 1 percent higher than the growth of other U.S. markets (1.7 percent). It is interesting to note that the demand increases after the Great Recession is stronger in the larger markets.
The high ADR and healthy demand growth that have attracted developers and supply in the Top 25 Markets is expected to see continued growth. The number of rooms in the in-construction phase represents 5 percent of existing Top 25 Market supply. New York City and Nashville lead the top markets in projected growth, showing 12 percent and 11 percent, respectively, of their existing supply in rooms under construction. No doubt, development in the Top 25 Markets is still a focus; approximately 40 percent of the total number of rooms in the U.S. pipeline are located within the Top 25 Markets.
Looking ahead, STR and Tourism Economics’ latest forecast calls for continued performance growth for the United States through at least 2019. Included in that projection, 24 of the Top 25 Markets are expected to post a RevPAR increase for 2019. The exception is Minneapolis/St. Paul, which hosted the 2018 Super Bowl with the corresponding enormous RevPAR lift, and therefore will report comparably lower results in 2019.


