

A comprehensive study of more than 800 meeting planners in North America, the Destination Meeting Assessment Program (Destination MAP) provides a detailed description of planners’ preferences and their perceptions of 40 North American markets across more than 60 considerations. The study is currently in its 17th publication, which allows trend analysis of the issues most important to meeting planners in site selection, including whether meeting planners identify certain destinations as having “high hotels costs.”

In the survey’s most recent iteration, which took place in spring of 2017, STR found that two-thirds of meeting planners rate “high hotel costs” as a reason to rule out a meeting destination. In fact, high hotel costs rank third—behind unsanitary conditions and safety—as planners’ greatest concern when selecting a destination for their meeting site.
Conventional wisdom suggests that markets rated as having high hotel costs by meeting planners would be the markets actually charging a higher average daily rate (ADR) for group business. To test this wisdom, the ratings of the 40 destinations evaluated were plotted against the actual 2016 group ADR for each destination. A “best fit” line was then applied to a scatterplot, yielding some results that contradicted the aforementioned conventional wisdom. The full version of this scatterplot is below.
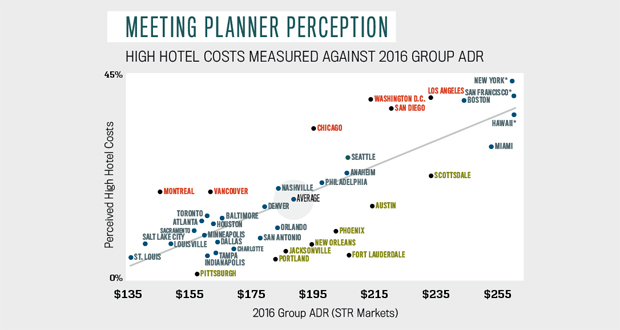
Most destinations followed a predictable pattern—the higher the market ADR, the more likely the market was rated as having high hotel costs. However, there were a handful of markets that did not follow this pattern:
- Group 1 (Higher Perceived Hotel Costs) This group includes markets with higher perceived “high hotel costs” ratings relative to actual 2016 group ADR. The destinations falling into Group 1 are sorted by ADR of more than $195 (Chicago, Los Angeles, San Diego, and Washington, D.C.) and ADR less than $195 (Montreal and Vancouver).
- Group 2 (Lower Perceived Hotel Costs) This group includes markets earning lower “high hotel costs” ratings relative to actual 2016 group ADR. The destinations falling into Group 2 are also sorted by ADR of more than $195 (Austin, Fort Lauderdale, New Orleans, Phoenix, and Scottsdale) and ADR less than $195 (Jacksonville, Pittsburgh, and Portland).
The quadrant analysis in the scatterplot shows all 40 markets relative to the “best fit” line. The Group 1 and Group 2 markets are those that are significantly above (red) and significantly below (green) the line.
Hoteliers, destination marketing organizations (DMOs), and meeting planners can all benefit from understanding the market dynamics in play when hotel rooms are priced for group business. Hoteliers and DMOs gain a better understanding of how their market is perceived, so they can adjust rates, marketing programs, and the group offerings accordingly. Similarly, meeting planners with a better understanding of where the market is positioned can gain negotiating power.
About the Author
Chris Klauda is the director of destination research at STR.


