

On a superficial level, the implications of the rising costs of customer acquisition are easily identified. Increased costs lead to a decline in profitability, which results in a loss of asset value. However, like most things, it is never quite that simple.
One of the first areas to consider in this type of analysis is the economic cycle in which the industry is operating. In a strong economy, like the one the United States has been experiencing over the last several years, many revenue strategy sins can be covered up by occupancies that are improving and average room rates that are increasing. Combine these two key performance indicators and all seems well; however, the truth lies beneath the surface. In this kind of environment, any increased costs incurred to acquire the customer can be obscured by the increased level of room revenue. For example, if your hotel-collected RevPAR increased by 5 percent, that may appear to be excellent on the top line, but what might not be so obvious is the additional 1 percent in acquisition costs that are slowly eroding the bottom line.
Additionally, the analysis is made more complex by dynamically changing quantities of rooms booked through the OTA net or merchant models, where vendors keep their commission prior to sending funds to the property, or through wholesalers. In those cases, any incremental customer acquisition costs would be absent from the property P&L.
In contrast, when the costs to acquire the customer are increasing in a declining or recessionary economic environment—for instance, the most recent in 2008 and 2009—there is a much more obvious and dramatic impact on profitability and net asset value. Using the inverse example, if your hotel-collected RevPAR declined 5 percent while the cost of customer acquisition simultaneously increased by 1 percent, the effect on the property’s profit would be more substantial, as the change in both the revenue and cost metrics would be negative and declining.
Since bad behavior in an upcycle is not as apparent, it is easy to fall into bad habits, and one must react quickly once the cycle tide turns for the worse, making it critical to constantly and accurately track customer acquisition costs for your property as well as the industry at large. The U.S. lodging industry’s past behavior in times of economic stress has been to embrace high-cost booking channels; yet taking care to understand and manage these costs even under favorable economic conditions will result in a much better financial outcome when the inevitable economic downturn occurs.
Tracking your net revenue performance based on the contribution to operating profit and expenses (COPE) can be calculated as a percentage of guest-paid room revenue. By tracking both the absolute percentage and its change from a prior time period, one will get a much more transparent indicator of customer acquisition efficiency and the direction in which it is trending.
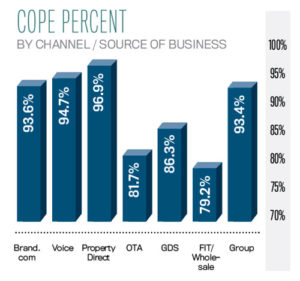
The first chart presents the COPE percentage for all U.S. hotels and each of the seven major channels/source-of-business categories for July 2017 YTD. It is evident that there are certain booking channels that are much more profitable to hotels than others. Not surprisingly, brand.com and voice channels, where guests book directly with the hotel, are significantly more cost effective compared to the indirect channels like OTAs and global distribution systems (GDS). The magnitude of the difference can be quite stark, ranging from a revenue capture of around 95 percent for direct channels and about 80 percent for the indirect channels. While not shown on the chart, the COPE percent declined in July year-over-year for five of the seven source-of-business categories and for the industry as a whole.
Because industry-wide numbers aggregate all property types, another way to look at the acquisition cost efficiency of the industry is to segment performance by property guest-paid ADR. In the second chart, we present the COPE percent by guest-paid room rate. As shown, generally speaking, the lower priced the property, the higher the COPE percent. While this may seem slightly counterintuitive, lower-rated properties tend to be smaller and have lower occupancies. Guests booking those properties tend to have a much shorter booking window, if they pre-book at all, meaning the hotels have a strong reliance on the direct booking channels due to the “walk-in” or “front desk phone reservation” nature of their business.
Understanding and monitoring customer acquisition costs, both at a hotel and industry level, is the first step in helping maximize profitability in strong economic times and better preparing for an economic downturn.
About the Author
Mark Lomanno is a partner and senior advisor at Kalibri Labs.


